DEMOGRAPHICS
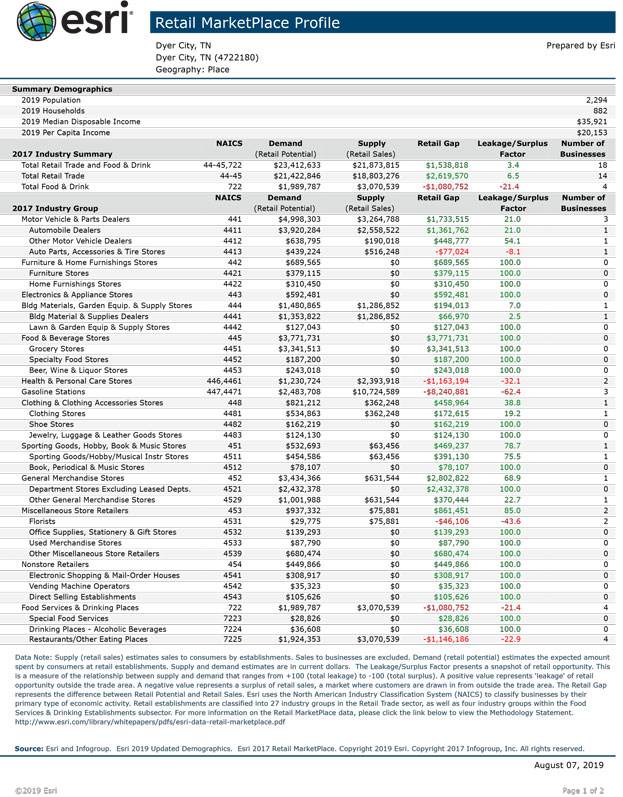
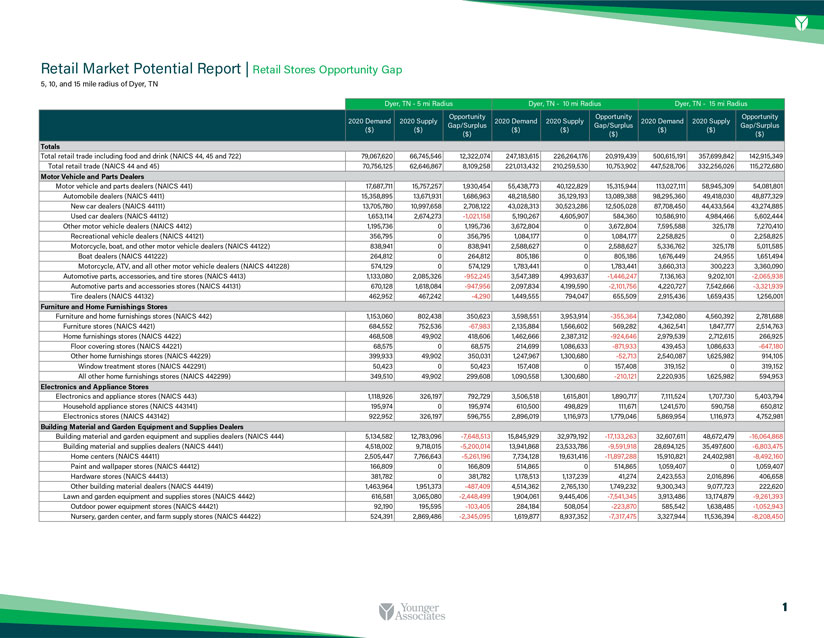
Marketplace Reports
Click on the image or button to view the full report
Demographics Reports
Click on the image or button to view the full report
Below you will find our Demographics Report for the Dyer Industrial Park Select Tennessee Certified Site, supplied in partnership with the Tennessee Department of Economic and Community Development and ESRI.
Summary
| Census 2010 | 2021 | 2026 | |
| Population | 2,347 | 2,263 | 2,230 |
| Households | 906 | 865 | 851 |
| Families | 615 | 599 | 586 |
| Average Household Size | 2.47 | 2.5 | 2.51 |
| Owner Occupied Housing Units | 618 | 613 | 605 |
| Renter Occupied Housing Units | 288 | 252 | 246 |
| Median Age | 39.8 | 44.4 | 45.7 |
Trends: 2021-2026 Annual Rate
| Area | State | National | |
| Population | -0.29% | 0.89% | 0.71% |
| Households | -0.33% | 0.91% | 0.71% |
| Families | -0.44% | 0.79% | 0.64% |
| Median Household Income | 3.88% | 2.14% | 2.41% |
Households by Income
| 2021 Number | 2021 Percentage | 2026 Number | 2026 Percentage | |
| <$15,000 | 159 | 18.40% | 144 | 16.92% |
| $15,000 – $24,999 | 111 | 12.80% | 102 | 11.99% |
| $25,000 – $34,999 | 156 | 18.00% | 123 | 14.45% |
| $35,000 – $49,999 | 100 | 11.60% | 91 | 10.69% |
| $50,000 – $74,999 | 134 | 15.50% | 139 | 16.33% |
| $75,000 – $99,999 | 81 | 9.40% | 91 | 10.69% |
| $100,000 – $149,999 | 77 | 8.90% | 99 | 11.63% |
| $150,000 – $199,999 | 23 | 2.70% | 31 | 3.64% |
| $200,000+ | 25 | 2.90% | 31 | 3.64% |
Population by Age
| Census 2010 Number | Census 2010 Percentage | 2021 Number | 2021 Percentage | 2026 Number | 2026 Percentage | |
| 0 – 4 | 145 | 6.18% | 115 | 5.08% | 107 | 4.80% |
| 5 – 9 | 161 | 6.86% | 114 | 5.04% | 116 | 5.20% |
| 10 – 14 | 171 | 7.29% | 115 | 5.08% | 118 | 5.29% |
| 15 – 19 | 163 | 6.95% | 126 | 5.57% | 113 | 5.07% |
| 20 – 24 | 133 | 5.67% | 135 | 5.97% | 117 | 5.25% |
| 25 – 34 | 275 | 11.72% | 289 | 12.77% | 281 | 12.60% |
| 35 – 44 | 258 | 10.99% | 255 | 11.27% | 246 | 11.03% |
| 45 – 54 | 294 | 12.53% | 254 | 11.22% | 258 | 11.57% |
| 55 – 64 | 245 | 10.44% | 303 | 13.39% | 282 | 12.65% |
| 65 – 74 | 233 | 9.93% | 268 | 11.84% | 275 | 12.33% |
| 75 – 84 | 167 | 7.12% | 191 | 8.44% | 219 | 9.82% |
| 85+ | 102 | 4.35% | 99 | 4.37% | 101 | 4.53% |
Race and Ethnicity
| Census 2010 Number | Census 2010 Percentage | 2021 Number | 2021 Percentage | 2026 Number | 2026 Percentage | |
| White Alone | 1,825 | 77.76% | 1,851 | 81.79% | 1,815 | 81.39% |
| Black Alone | 463 | 19.73% | 334 | 14.76% | 320 | 14.35% |
| American Indian Alone | 1 | 0.04% | 2 | 0.09% | 2 | 0.09% |
| Asian Alone | 3 | 0.13% | 6 | 0.27% | 8 | 0.36% |
| Pacific Islander Alone | 0 | 0.00% | 0 | 0.00% | 0 | 0.00% |
| Some Other Race Alone | 2 | 0.09% | 8 | 0.35% | 10 | 0.45% |
| Two or More Races | 53 | 2.26% | 62 | 2.74% | 76 | 3.41% |
| Hispanic Origin (Any Race) | 20 | 0.85% | 31 | 1.37% | 36 | 1.61% |
Educational Attainment 2021
| Area | State | National | |
| Associate’s Degree | 8.68% | 7.49% | 8.67% |
| Bachelor’s Degree | 10.61% | 18.43% | 20.60% |
| Graduate Degree | 7.66% | 11.06% | 13.00% |


